October 27, 2021

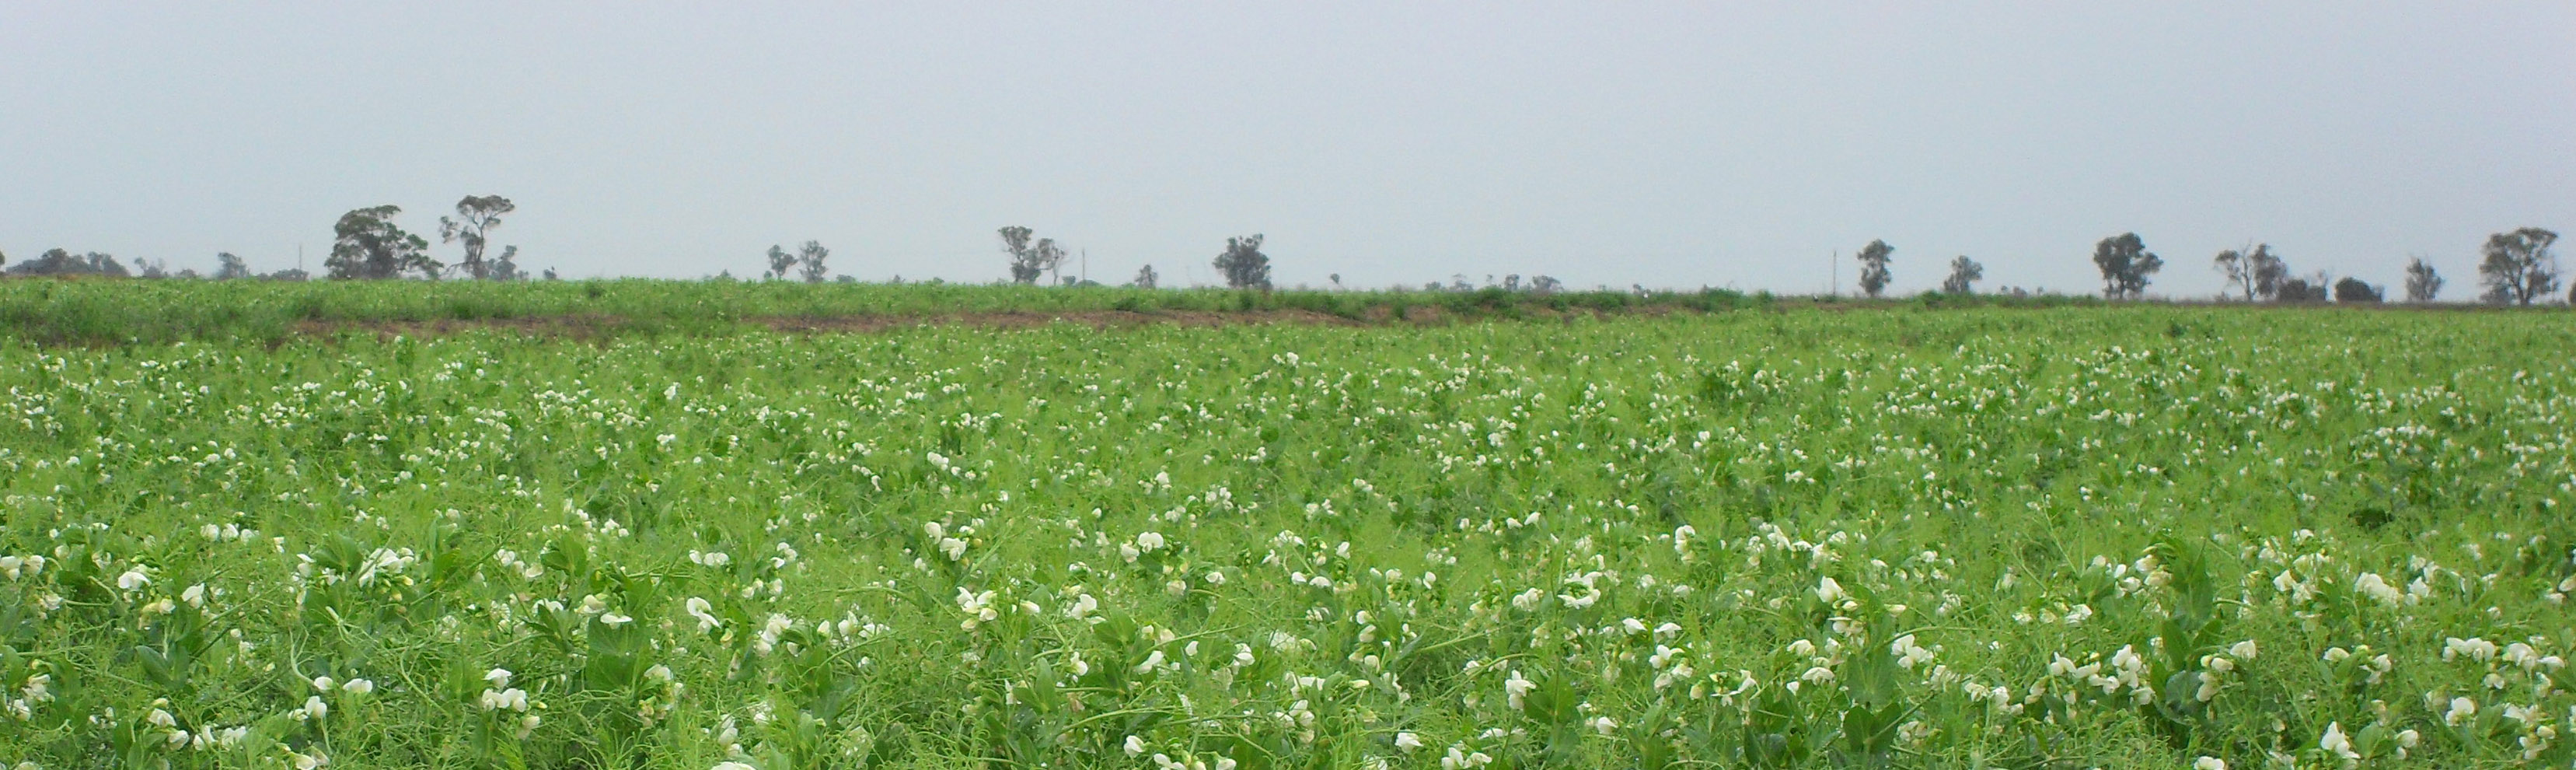
Harvest for the 2021 crop has started in Australia and in the current scenario of tight global supply, anticipation for the crop is high, on the part of the consumers as much as the producers.
A good crop is expected this year, replenishing stocks of high protein wheat, canola, lentils and a few other crops, which were significantly affected by the North American drought. Asian importers are also looking forward to continuing their accelerated purchases of desi chickpeas, a market in which Australia holds the monopoly.
High international prices combined with good yields will bring windfall profits to Australian farmers for the second season in a row. This is a big relief to the country’s agricultural industry, which suffered from the effects of two severe droughts in 2018 and 2019.
Through this article, we want to introduce GPC members to our yield model, which we have successfully used to display information about crops of chickpeas, lentils, peas, wheat, corn, soybean and rapeseed for all the major producers of the respective crops. For this article, our scope is limited to chickpea and lentil production for the year 2021.
First, let’s look at the official numbers.
The latest ABARES Crop Report puts chickpea production at 844K MT and a national yield of 1.33 t/ha. The corresponding lentil numbers are 639 KMT and 1.64 t/ha. Last year’s numbers were 733K MT of chickpea production and a yield of 1.44 t/ha and 634 KMT of lentil production at a yield number of 1.72 t/ha.
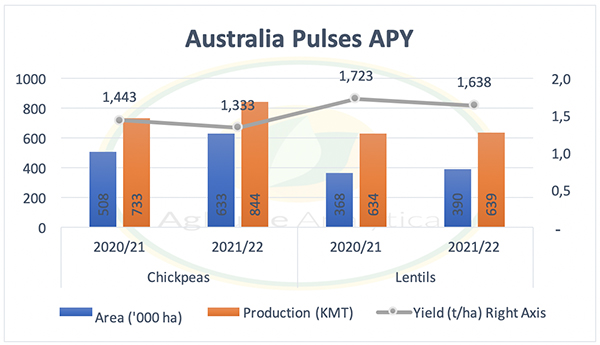
Source: ABARES
As per ABARES, Australia produced 733 KMT of chickpeas and 634 KMT of lentils last year, while ABS export figures from Oct’20 to Aug’21 totalled 891 KMT of chickpeas and 888 KMT of lentils. It is noteworthy that the 2018 and 2019 exports dragged due to poor crop production. It is difficult to believe that the stocks as of October 1, 2020 were large enough to cover the current export program and expanded acreage.
At AgPulse, we believe in the power of technology and to come to a production number, we keep an eye in the sky, rather than boots on the ground.
Our model takes into account the growing conditions, namely soil moisture, sub-soil moisture, precipitation levels, minimum and maximum temperatures and deviation in the planting window. We start running the model from the middle of planting and run it twice a month until the mature stage.
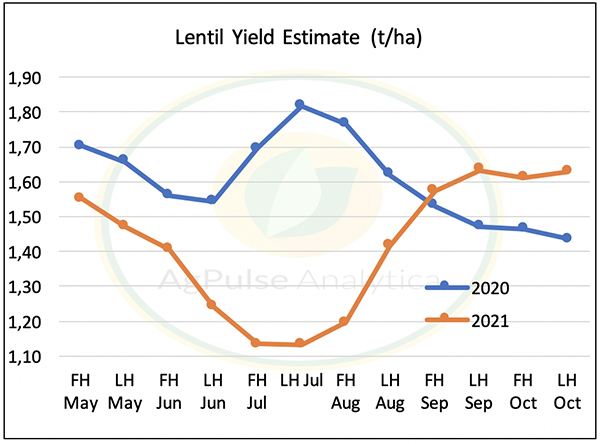
As the saying goes, “Rain makes Grain,” and our yield expectations ran wild this year due to good precipitation levels. A dry spell in April and May kept our yield projection low, while good rainfall during June helped the yield number rise again. Precipitation levels are one of the inputs in our model and the following table shows the monthly variation across growing regions, with the corresponding model results below.
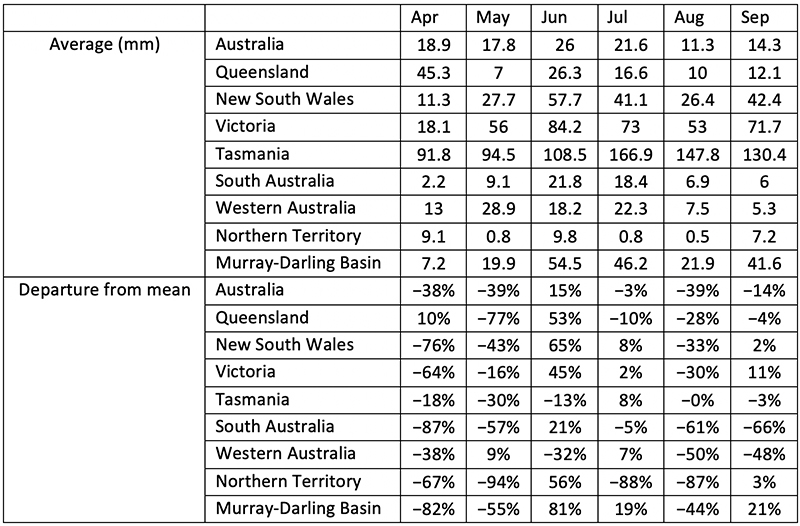
Table 1 Source: BOM, Australia
Our model puts the nationwide chickpea yield number at 1.51 t/ha and 1.55 t/ha for lentils. Comparatively, the model puts 2020 chickpea yield at 1.55 t/ha and lentils at 1.44 t/ha.
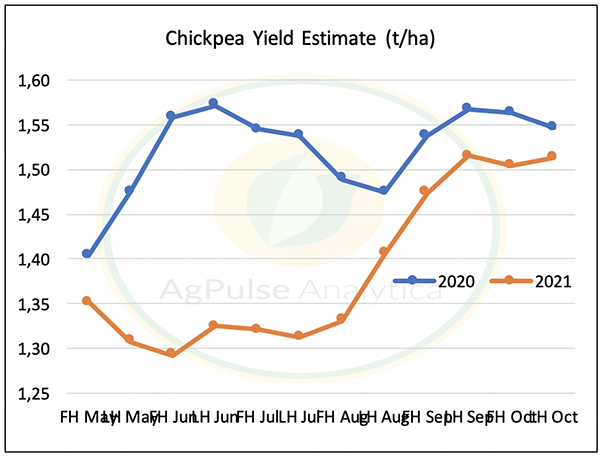
Source: AgPulse Analytica
Source: AgPulse Analytica
With these yield numbers, juxtaposed with the ABRES acreage statistics, the production estimate is 958 KMT for chickpeas and 636 KMT for lentils.
To discuss the yield model and any other questions, contact Gaurav Jain at gaurav@agpulse.net.
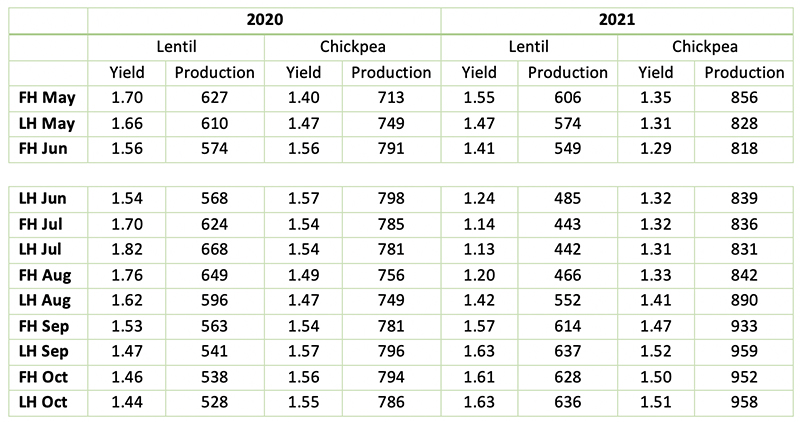
Source: AgPulse Analytica & ABARES
Disclaimer: The opinions or views expressed in this publication are those of the authors or quoted persons. They do not purport to reflect the opinions or views of the Global Pulse Confederation or its members.